
CIPFA's Financial Resilience Index is a comparative analytical tool intended for use by Chief Financial Officers to support good financial management.
The index shows a council's position on a range of measures associated with financial risk highlighting where additional scrutiny may be required.
The data
The data for the resilience index is obtained from the Revenue Expenditure and Financing England Outturn Report 2022-23 ('RO Forms') and reflects figures submitted by Local Authorities to DLUHC as at 31 March 2023.
While recognising some limitations in the returns (eg reflecting the previous financial year) they provide a consistent and transparent starting place for a discussion on financial resilience.
Explanatory Note
- The index is based on the published data from the RO form. Where information is missing from this form it will also be missing from the index
- Local Authorities that have not submitted their data or submitted data late will not included in the Resilience Index until the RO data is refreshed.
- We will update the index in due course
For more detail please visit the DLUHC statistical website
Findings from the Resilience Index 2023
The findings of the Resilience Index 2023 shows that reserves have fallen and that social care expenditure is still increasing. This is in line with other evidence from the sector and while it may not be unexpected it is crucial to understand that these two indicators play an important part in the sustainability and health of the local government sector.
Reserves
The CIPFA Resilience Index shows local authority reserves have fallen overall during 2022/23. This reflects the significant financial pressures that local authorities face and the fact they have now used the legacy reserves that existed as a result of COVID.
Figure 1: Earmarked and unearmarked reserves for English local authorities 2016/17–2022/23
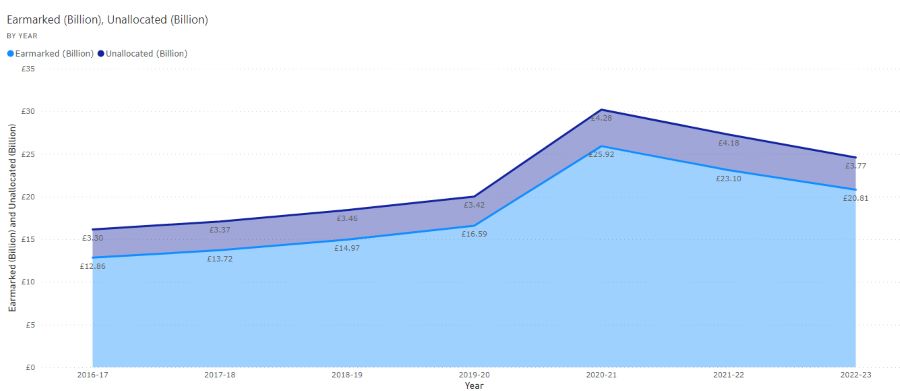
In 2022/23 a total of £24bn worth of reserves has been identified across English local authorities. Of that total only £3.7bn is not allocated for a specific purpose and may be classed as general reserves.
While the figure may appear high in totality, when broken down it is important to reflect on the fact that £3.7bn across the 317 local authorities in England represents approximately 3% of total service expenditure.
Local authorities use these reserves as a working balance to help cushion the impact of uneven cash flows or a ¬contingency to cushion the impact of unexpected events or emergencies. Balancing the annual budget by drawing on general reserves may be viewed as a legitimate short-term option. However, it is not normally prudent for reserves to be used to finance recurrent expenditure. CIPFA has commented that councils should be particularly wary about using one-off reserves to deal with shortfalls in current funding, but in the current financial climate many authorities are balancing budgets using reserves. This means that those with a weak reserves position are vulnerable to financial instability.
A more detailed explanation of reserves can be found in CIPFA Bulletin 13 Reserves and Balances.
Social care
A significant proportion of upper tier English authorities’budgets are spent on social care services (for both adults and children) with amounts still increasing annually. The growth in demand for services of this nature and the cost of delivering them has risen steadily since 2016/17 and attempts at reform have failed to lead to significant change. CIPFA’s recent publication Charging for adult social care in England: reform and routes forward provides a comprehensive insight into the issues.
Figure 2: Average spend on social care for English local authorities 2016/17 to 2022/23
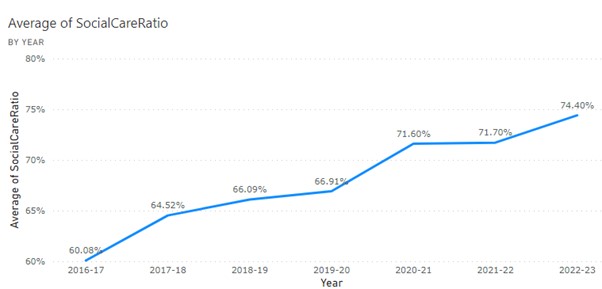
In 2022/23 nearly three quarters of the spend of authorities with social care responsibilities relate to this area of activity. The growth in expenditure means that there is less financial support for other council activities.
Of increasing concern is the fact that social care is a demand-led statutory service and so the upward trajectory of this graph will result in increased difficulties without significant funding improvements. CIPFA will be releasing a new publication in summer 2024 focusing on managing demand in social care.
External debt
Looking at the gross external debt there has been no evidence to suggest that debt is increasing across the sector. Our data has shown that the level of external debt has remained relatively stable in the last three years, having peaked in 2019/20.
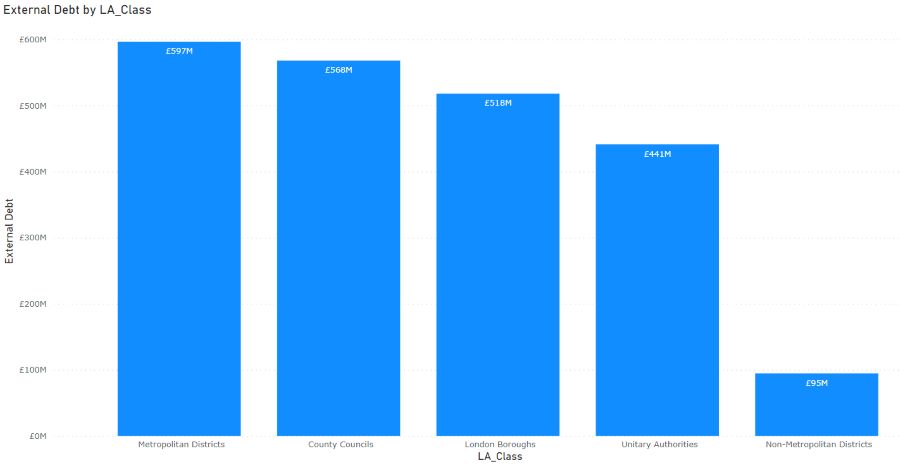
However, looking at average external debt by class of authority there is evidence that the greater levels of debt remain with upper tier local authorities such as metropolitan, county, unitary and London borough authorities.
When considering financial sustainability, large debt becomes an issue when the means to payback that debt fail. Strong governance and good financial management surrounding the debt portfolio are essential to maintain resilience.
Figure 3: Average levels of external debt for English local authorities 2016/17 to 2022/23
Conclusion
The Resilience Index indicators continue to identify many authorities that show signs of financial pressure, not only in the three criteria discussed in this summary but across the measures used to show signs of financial stress.
While no single indicator can point to failure, any combination of these pressures would give serious cause for concern and year on year the ability of any authority to manage the budget becomes more difficult.
Managing to balance budgets and continue to deliver effective and efficient services must be something all authorities are in a position to do and the focus has to be the creation of a more sustainable sector.
Use the Resilience Index