Focusing on library services, archive services, leisure and other facilities, this theme presents comprehensive financial and non-financial datasets, which enables insight on income and expenditure and helps with the budget and business planning and service reviews.
Public Libraries Dashboard
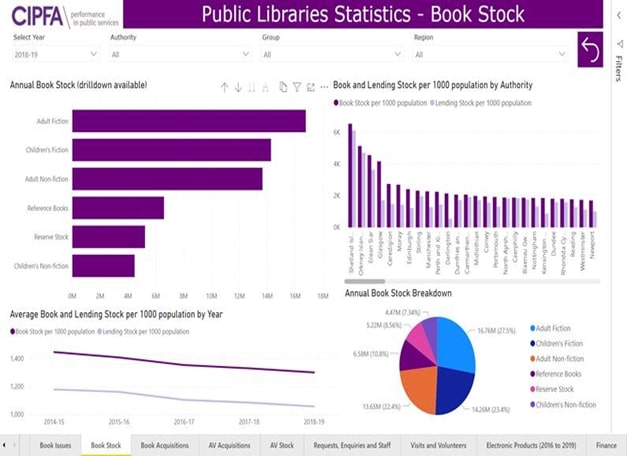
Transforming CIPFA’s Public Libraries statistics, this interactive Power BI dashboard provides information and analysis with visualisations and dynamic features to illustrate the position of libraries at the local authority level across the past five years. The Libraries dashboard contains a variety of analysis pages, such as on finance, service points, electronic products, book stock and audio-visual stock, and is updated following the release of the annual statistics.
What is the benefit?
Offers you a comprehensive, visually compelling way to interact with a dataset that will provide ample information, aiming to help strengthen your library service.