
The police datasets are designed to help drive better financial management and decision making across a police force. Through current comparative data and the provision of a broad range of analytical and diagnostic capacity, these datasets can help forces deliver and demonstrate value for money. At CIPFA we produce three Police CIPFAstats products. These are the Police Objective Analysis Estimates and two summary police statistics called the Police Actuals and Police Estimates statistics.
The Police Objective Analysis (POA) Estimates statistics is one of the largest datasets we collect. It was developed to support the need for understandable, accurate and consistent information to allow internal and inter-force comparisons.
We examine data over both objective and subjective headings. The objective headings are grouped into one of 13 areas, which include local policing, intelligence, investigations and more. Information is also included on council tax, reserves and funding trends. Detailed outlier analysis is also conducted to identify patterns of spend that are outside the overall distribution of normal expenditure. The questionnaire and extensive guidance notes that accompany the annual CIPFA survey are fully reviewed and updated each year to reflect any feedback received from a technical group of practitioners across the country.
The Police Actuals and Police Estimates questionnaires are summary questionnaires of the POA. In these, we collect figures recorded from the current year and forecasted figures.
The Achieving Finance Excellence in Policing (AFEP) Programme was created in 2019 with a desire to combine existing POA financial data with available performance, demand and outcome data. 12 pieces of analytical data and benchmarking exercises were to be created. The dashboards for Business Enablers, Information and Communication Technology (ICT), Training, Mental Health, Capital Expenditure, Front Desk and Central Communications Unit have so far been completed. The aim of the programme is to enhance financial and performance data within the police sector and to dive deeper into the POA.
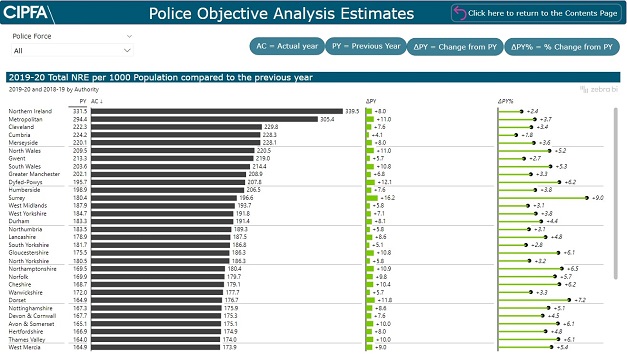
Police Objective Analysis Dashboard
The new POA dashboard consists of multiple interactive visualisations that illustrate police force expenditure and their Full Time Equivalent (FTE) across all 13 areas. The interactive ability of the dashboard means that forces can now drilldown into expenditure to explore their components and draw comparisons to ask the important questions regarding police authority expenditure. Analysis of expenditure in comparison to their peers over a five-year period can now be easily achieved as well as exploring the % change from previous years.
What is the benefit?
A comprehensive and easily digestible overview of accurate, understandable, consistent and interactive datasets across all FTE areas allowing for easy comparative analysis.
Police Actuals and Estimates Dashboard
The dashboard is split into recorded and forecasted figures from our annually collected survey data to produce a combined interactive dashboard. Expenditure, income, reserves and provisions data is explored across a range of functions.
What is the benefit?
A peer into the future; the new and improved dashboard gives you the opportunity to plan and forecast accurately.
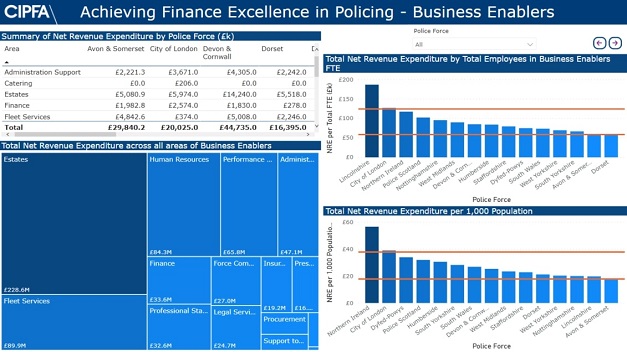
AFEP Police Business Enablers Dashboard
As part of the AFEP programme, Business Enablers was based on the Support Function section of the POA survey. Staff numbers and employee costs were collected across a range of support functions, eg human resources, finance, legal, fleet, estates etc. The top three areas of Business Enablers were selected for the dashboard: Estates, Fleet Services and HR, focusing on total net revenue expenditure per FTE/population.
What is the benefit?
Helping you to achieve excellence by understanding the contribution of key Business Enablers within your police service.
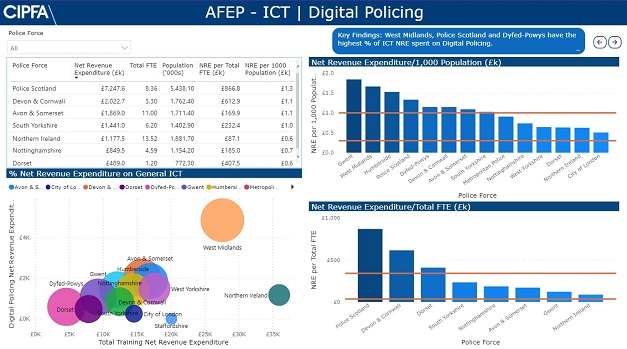
AFEP Police ICT Dashboard
As part of the AFEP programme, this topic on ICT was based on the Support Function section of the POA survey. Staff numbers and employee costs were collected across six areas of ICT. A non-qualitative section was also included in the survey to enable forces to give a rating on their force’s ICT control room, capabilities, risk and governance. The top three areas of ICT were selected for the dashboard, General ICT, ICT Development and Digital Policing, focusing on total net revenue expenditure per FTE/population.
What is the benefit?
Gives you an understanding of your ICT current functioning and expenditure with a focus on risk and governance so you can strategise for long-term positive development.
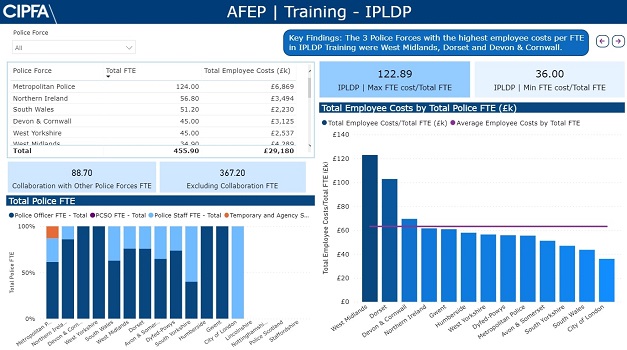
AFEP Police Training Dashboard
As part of the AFEP programme, this topic on training was based on the Support Function section of the POA survey. Staff numbers and employee costs were collected across 15 areas of training. A non-qualitative section was also included in the survey to enable forces to give a rating on their force’s training capabilities, demand analysis and skills. The top three areas of training were selected for the dashboard, IPLDP, Armed Response and Operational Support, focusing on total net revenue expenditure per FTE/population.
What is the benefit?
Provides you with the opportunity to analyse training capabilities and expenditures, establishing future demand and skills needs.
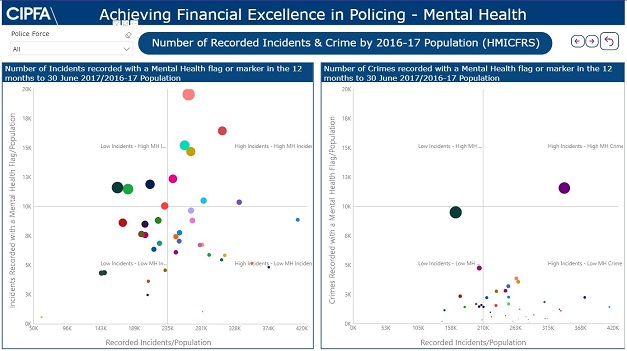
AFEP Police Mental Health Dashboard
The AFEP Mental Health dashboard consists of data collected from the CIPFA Mental Health Survey as well as from external sources such as HMICFRS, the Home Office and the National Crime Agency. A wide area is explored in this dashboard. We analyse the number of missing person incidents, mental ill health triage/support, the proportion of incidents involving mental health, the number of suicides and more. The interactive visualisations enable forces to see how they perform compared to other forces and to compare their levels of expenditure that are not only spent by police forces but also by their local authority.
What is the benefit?
An interactive, visual comparative analysis of the challenges faced by police authorities in dealing with mental health within your service.
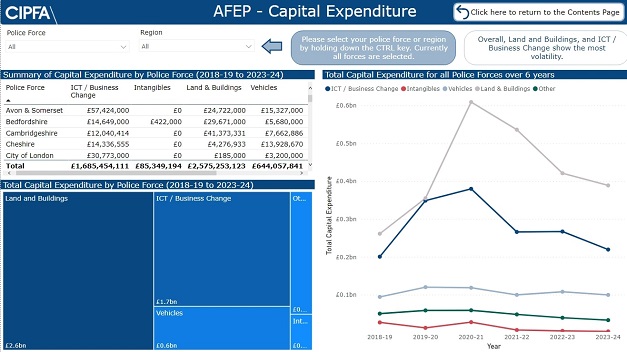
AFEP Police Capital Expenditure Dashboard
The AFEP Capital Expenditure dashboard consists of data collected from the Police and Crime Commissioners Treasurers Society (PACCTS) 2020/21 Budget Survey, Revenue Outturn (RO), Revenue Account (RA) Budget, Local Authority Borrowing, and Local Authority Investments data. Overall, the dashboard provides a range of interactive charts, enabling detailed and insightful analysis of police force capital expenditure and financing. Additional datasets include the ratio of financing costs to net revenue stream, total debt financing costs, debt financing costs to the taxpayer, revenue contributions and any outstanding borrowing. Users will be able to explore and manipulate the data, and easily compare their performance with other police forces.
What is the benefit?
Detailed and insightful comparative analysis of CapEx and financing taken from various official sources.
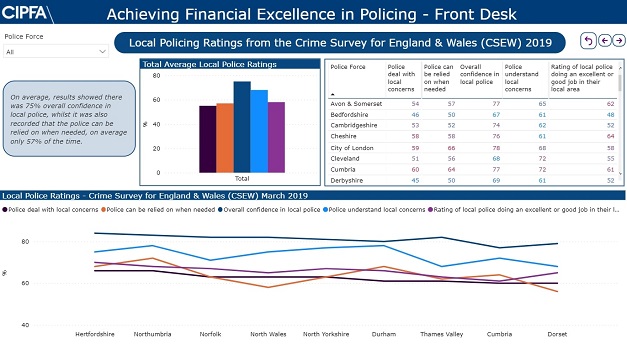
AFEP Police Front Desk Dashboard
The AFEP Front Desk dashboard dives deeper into the Dealing with the Public section of the POA. The dashboard highlights findings from the POA, as well as from data collected from Her Majesty's Inspectorate of Constabulary and Fire & Rescue Services (HMICFRS) and the Crime Survey for England and Wales (CSEW). Visualisations enable users to explore the level of public confidence in their local police and efficiency and effectiveness ratings, police force spend over the past five years and police staff costs. Data on the methods of communication used to contact the police are also included, reflecting the behavioural changes in communication within society, as well as how they now contact the police and thus the impact this will have on police front desks.
What is the benefit?
A visual tool to explore the effectiveness of your police force’s spend and the public's perception of the efficiencies, effectiveness, communication methods and overarching confidence in their local police force.
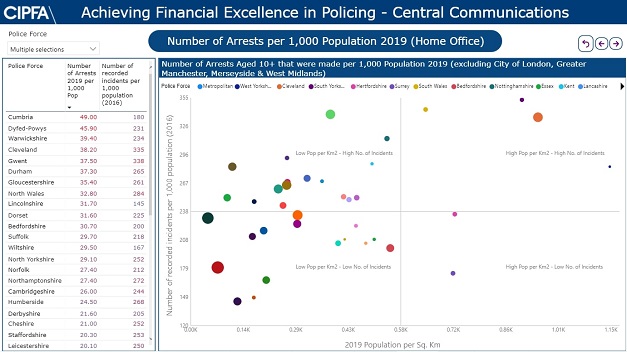
AFEP Police Central Communications Unit Dashboard
The AFEP Front Desk dashboard dives deeper into the Dealing with the Public section of the POA. The dashboard highlights findings from the POA, as well as from data collected from HMICFRS and the Crime Survey for England and Wales (CSEW). Comparisons are drawn between police forces to see who has higher levels of expenditure in their central communications unit, the number of 999 calls and the number of arrests made per population and more. The interactive visualisations enable users to select who they wish to compare themselves against.
What is the benefit?
An interactive and visual comparison tool enabling you to compare yourself against other force’s, applying a number of relevant metrics.
Upcoming AFEP dashboards include:
- Custody
- Cyber Crime
- Investigative Support
- Prevention and Deterrence
- Professional Standards
NPEG Police Property Benchmarking Dashboard
Available to subscribers of the NPEG Police Property Benchmarking exercise, this upcoming Power BI dashboard will serve as an enhancement of the current NPEG Excel Benchmarking tool, allowing users to interrogate the NPEG data across all of the years where CIPFA has conducted the benchmarking collection (2016 onwards).
What is the benefit?
A property benchmarking tool providing you with information spanning back to 2016, so that you can be informed and make your best choice moving forward.